How to create a shareable AI Visibility report in Orchly
Build a shareable AI visibility report that combines AI search, organic, rankings, and social data, then send a live link or export a PDF deck.
Whether you’re reporting to a client, a boss, or yourself, the work is the same: pull the numbers that matter into one clean view and share it. Reporting builds a shareable AI visibility report that combines your AI search, organic, ranking, and social data, with no spreadsheet wrangling.
You’ll find it under Reporting.
Create a report
Click Create Report and fill in the New Report form.
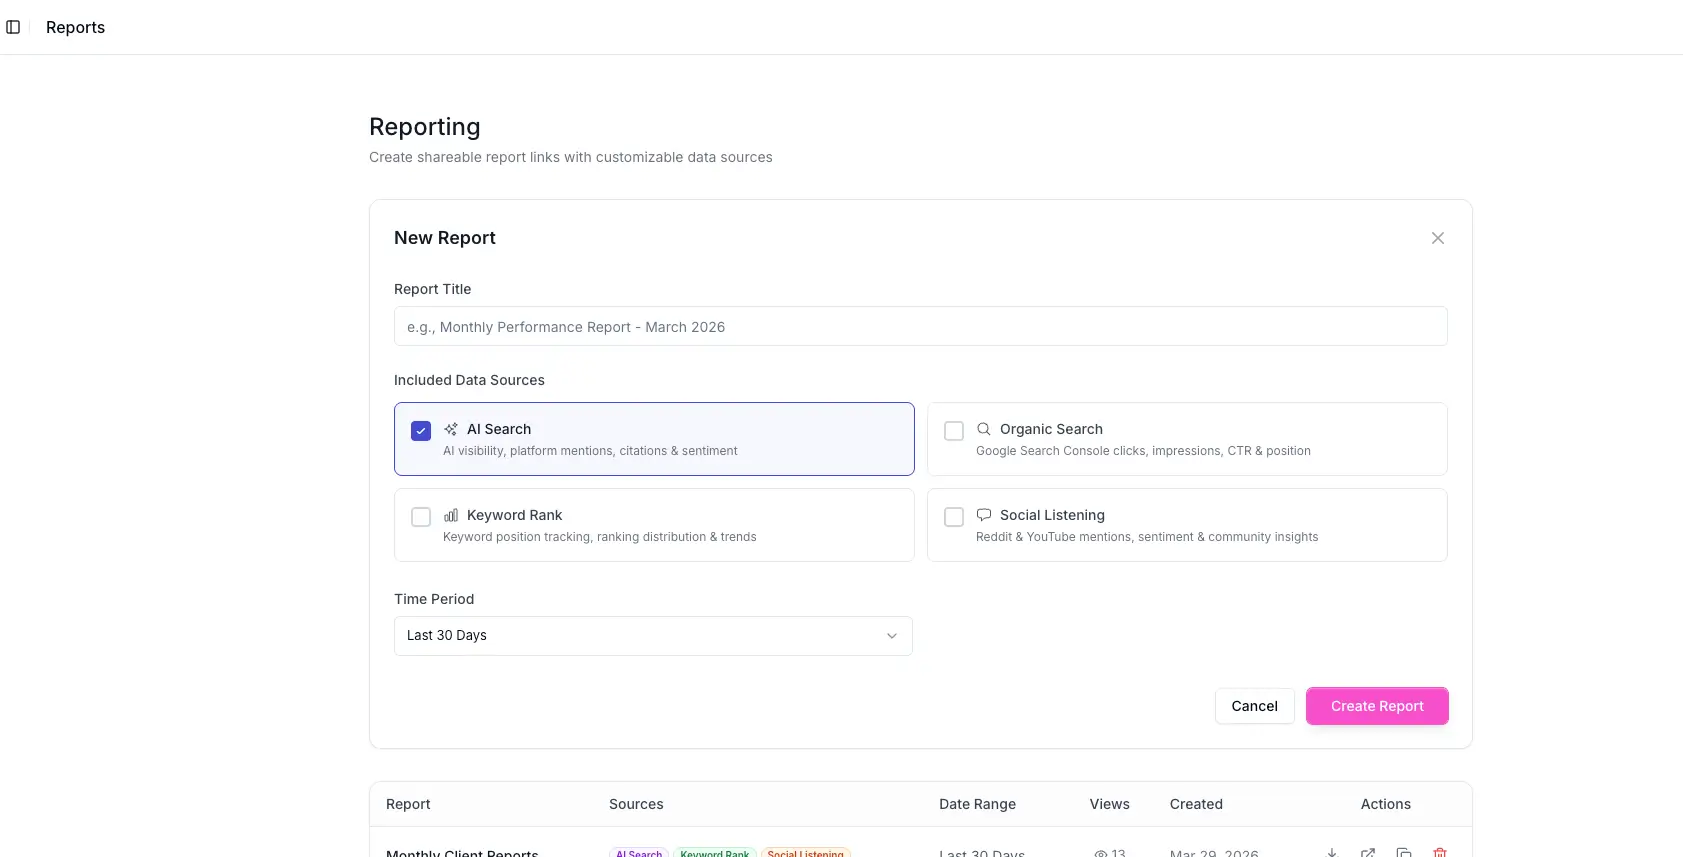
- Report Title, so you can tell reports apart later (for example, “Monthly Performance Report - March 2026”).
- Included Data Sources, the sections to include. Tick any combination:
- AI Search, AI visibility, platform mentions, citations, and sentiment.
- Organic Search, Google Search Console clicks, impressions, CTR, and position.
- Keyword Rank, keyword position tracking, ranking distribution, and trends.
- Social Listening, Reddit and YouTube mentions, sentiment, and community insights.
- Time Period, like Last 30 Days, with other ranges to choose from.
Click Create Report and Orchly generates a shareable report.
How the report opens and reads
The report isn’t a static file, it’s a clean, branded web page at its own link. Open it and it reads top to bottom like a deck: each data source you included becomes a section, with the headline numbers, trends, and charts laid out for someone who doesn’t live in Orchly.
That makes it just as good for a quick check as for a formal review. You can pull it up live on a call, send the link in an email, or export it as a PDF to drop into a slide deck or attach to a recap.
Share it
Each report in the list has actions to fit how you share:
- Copy the link to send a live, always-current report.
- Open it to view the report yourself.
- Download a PDF for an email attachment, a deck, or a printed leave-behind.
- Delete it when it’s no longer needed.
The Views column shows how many times each shared report has been opened, so you know your client actually looked.
Why agencies love it
Reporting is built for the people who report for a living:
- Client reporting on autopilot. Share one live link per client and it stays current, so you stop rebuilding the same deck every month.
- Pitches and reviews. Export a clean PDF to show a prospect their AI visibility gap, or to walk a client through the month’s wins.
- Your brand, not ours. White-label the report with your own logo and name so it looks like your agency’s work. See white labeling.
- Proof you can point to. The view count and live data make the results impossible to argue with.
Set the time period to a rolling window like “Last 30 Days” and share the link once. It always shows the latest, so a client can check progress whenever they like instead of waiting for your monthly PDF.
A report can only include data you’ve connected. To show organic numbers, connect Search Console; for rankings, set up the rank tracker; for AI search, set up AI visibility.