How to track product visibility in AI shopping
See which of your products appear when AI engines answer shopping questions, which merchants carry them, and which prompts trigger shopping results.
When someone asks ChatGPT “what are the best noise-cancelling headphones,” the answer often includes a shortlist of specific products. Shopping visibility tracks whether your products make that shortlist, how you rank against rival brands, and which retailers AI engines point buyers to.
You’ll find it under AI Search Analytics → Shopping.
The four shopping views
Shopping is split into four tabs, each answering a different question:
- Brands, how visible your brand is in shopping answers versus competitors.
- Merchants, which retailers carry your products in those answers.
- Products, which of your products show up, at what price and position.
- Prompts, which questions trigger shopping results in the first place.
Shopping visibility runs off the same prompts and brands as your AI visibility tracking. Once that’s set up, shopping data fills in automatically.
Brands
The Brands tab is your scoreboard for the category.
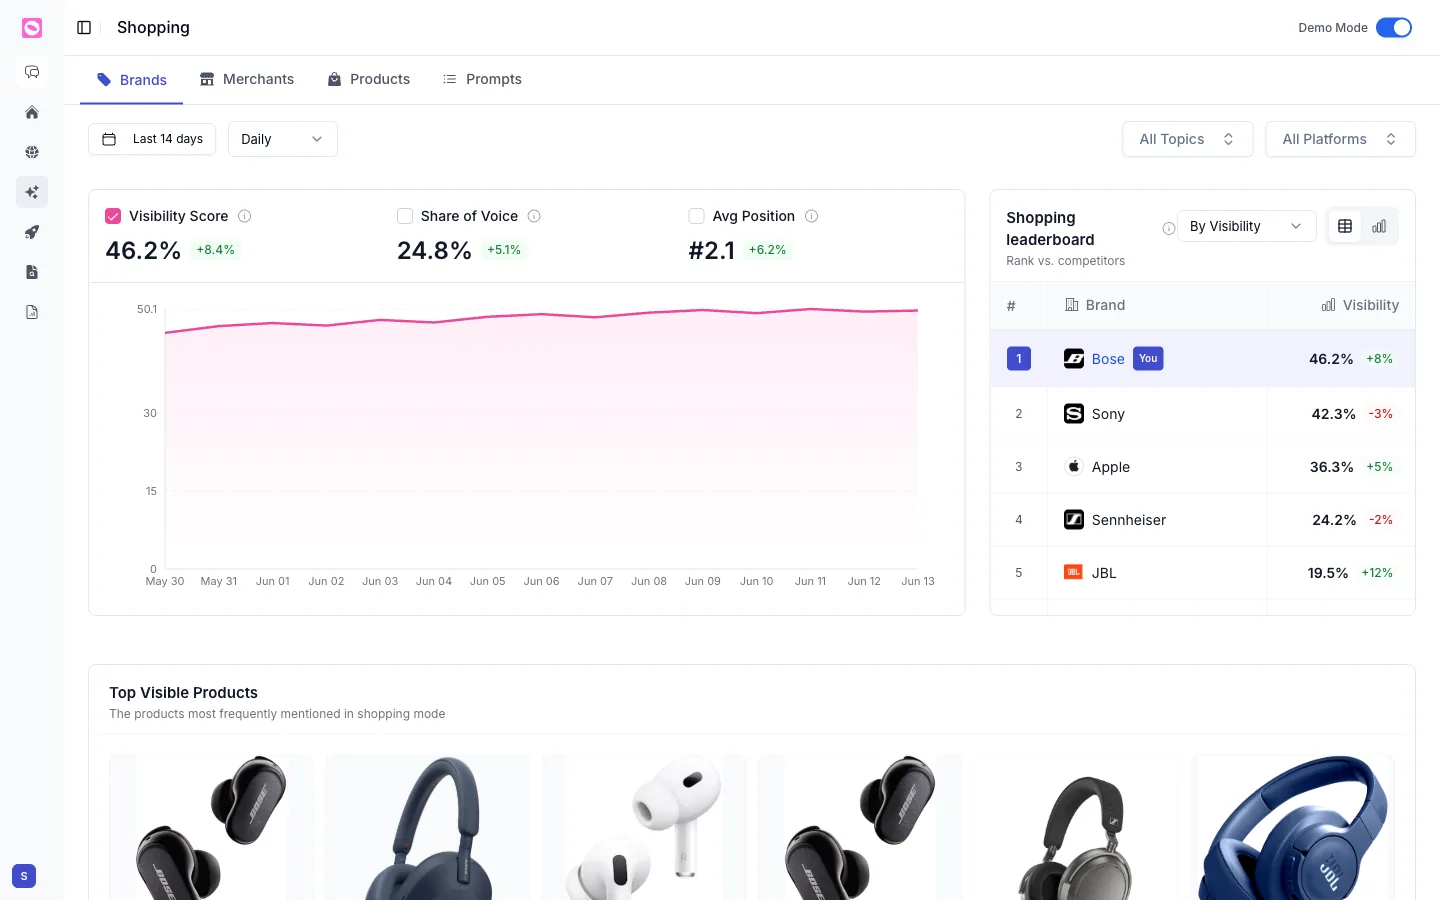
It opens with three scores, each with its change over the period:
- Visibility Score, how present your brand is in shopping answers.
- Share of Voice, your slice of all brand mentions in those answers.
- Avg Position, where your products tend to land when listed. Lower is better.
A trend chart tracks them over time. The Shopping leaderboard ranks you against competitors by visibility, with your brand marked You, so you can see exactly who’s beating you and by how much.
Lower down, Top Visible Products shows the items that come up most often in shopping mode, the quickest way to see which of your products AI engines actually recommend and which never surface.
Merchants
The Merchants tab shows which retailers AI engines name when they recommend products like yours, Amazon, Best Buy, Walmart, your own store, and so on. It’s where AI sends buyers to check out.
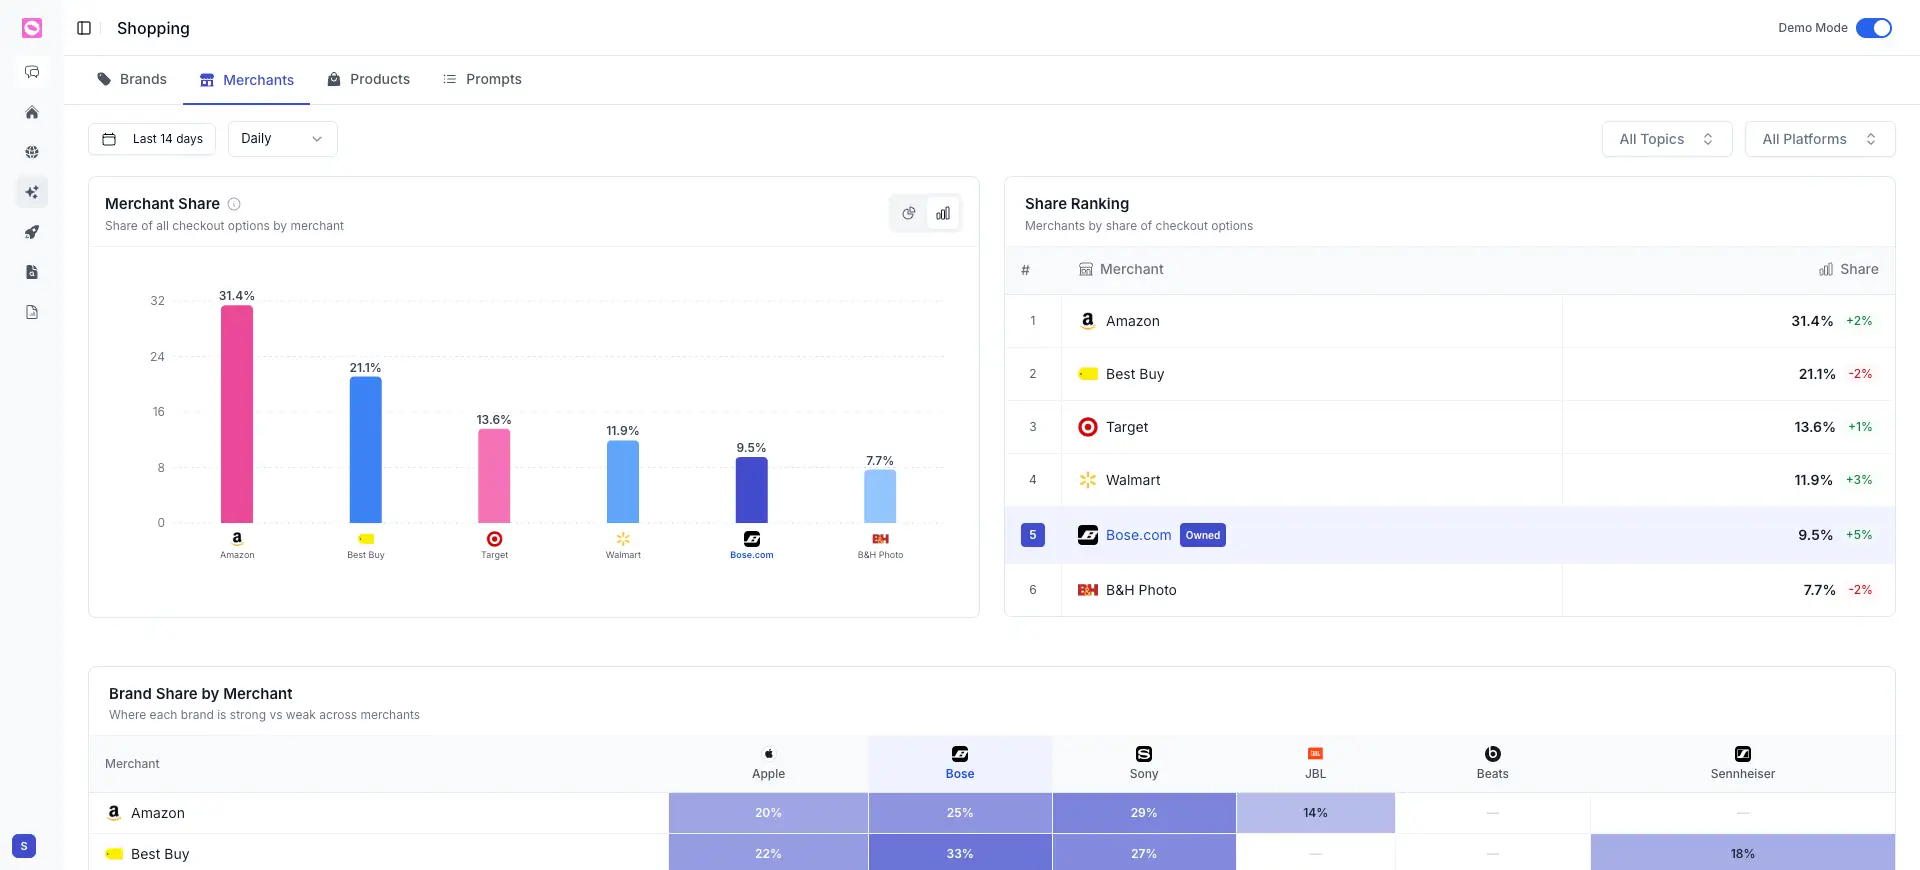
Three panels break it down:
- Merchant Share charts each retailer’s share of all checkout options AI offers.
- Share Ranking ranks merchants by that share, with the change over time. Your own store is tagged Owned, so you can see how your direct channel stacks up against the marketplaces.
- Brand Share by Merchant is a matrix showing where each brand is strong or weak across retailers, so you can spot a merchant where you under-index.
If a marketplace you don’t sell on dominates, or your Owned share is low, that’s a distribution gap worth a conversation.
Products
The Products tab lists every product that appears in shopping answers. Click any row to see its offers across retailers.
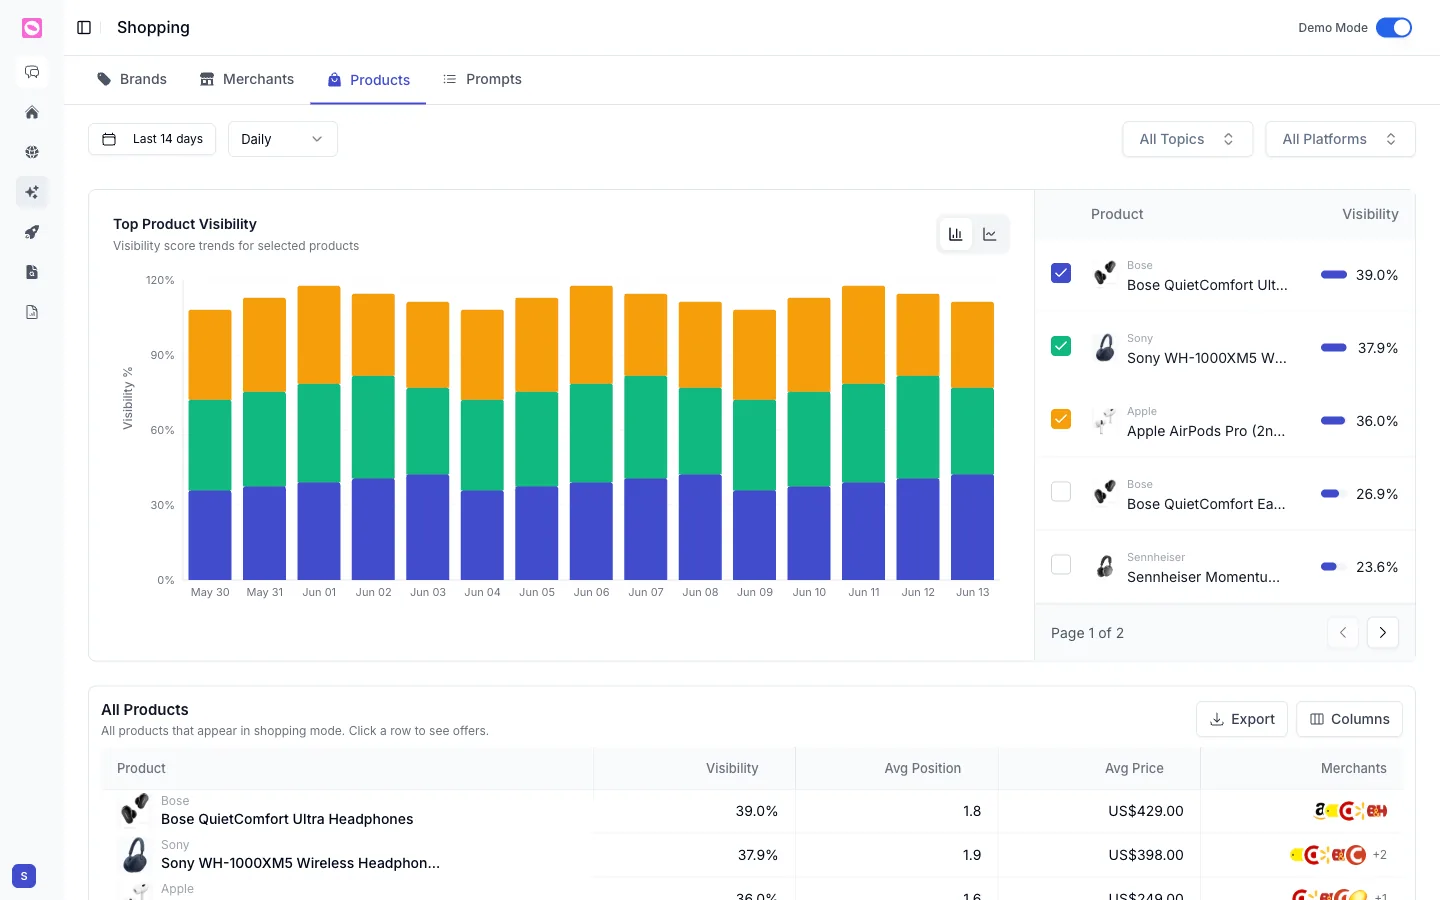
The table gives you, per product:
| Column | What it shows |
|---|---|
| Visibility | How often the product appears in shopping answers |
| Avg Position | Where it tends to rank when listed |
| Avg Price | The price AI engines cite for it |
| Merchants | The retailers carrying it (click the row for full offers) |
Watch the Avg Price column especially. If AI engines are quoting an old or wrong price for your product, that traces back to a merchant feed or a page that needs fixing.
Prompts
The Prompts tab shows how often each question triggers shopping mode at all, grouped by topic.
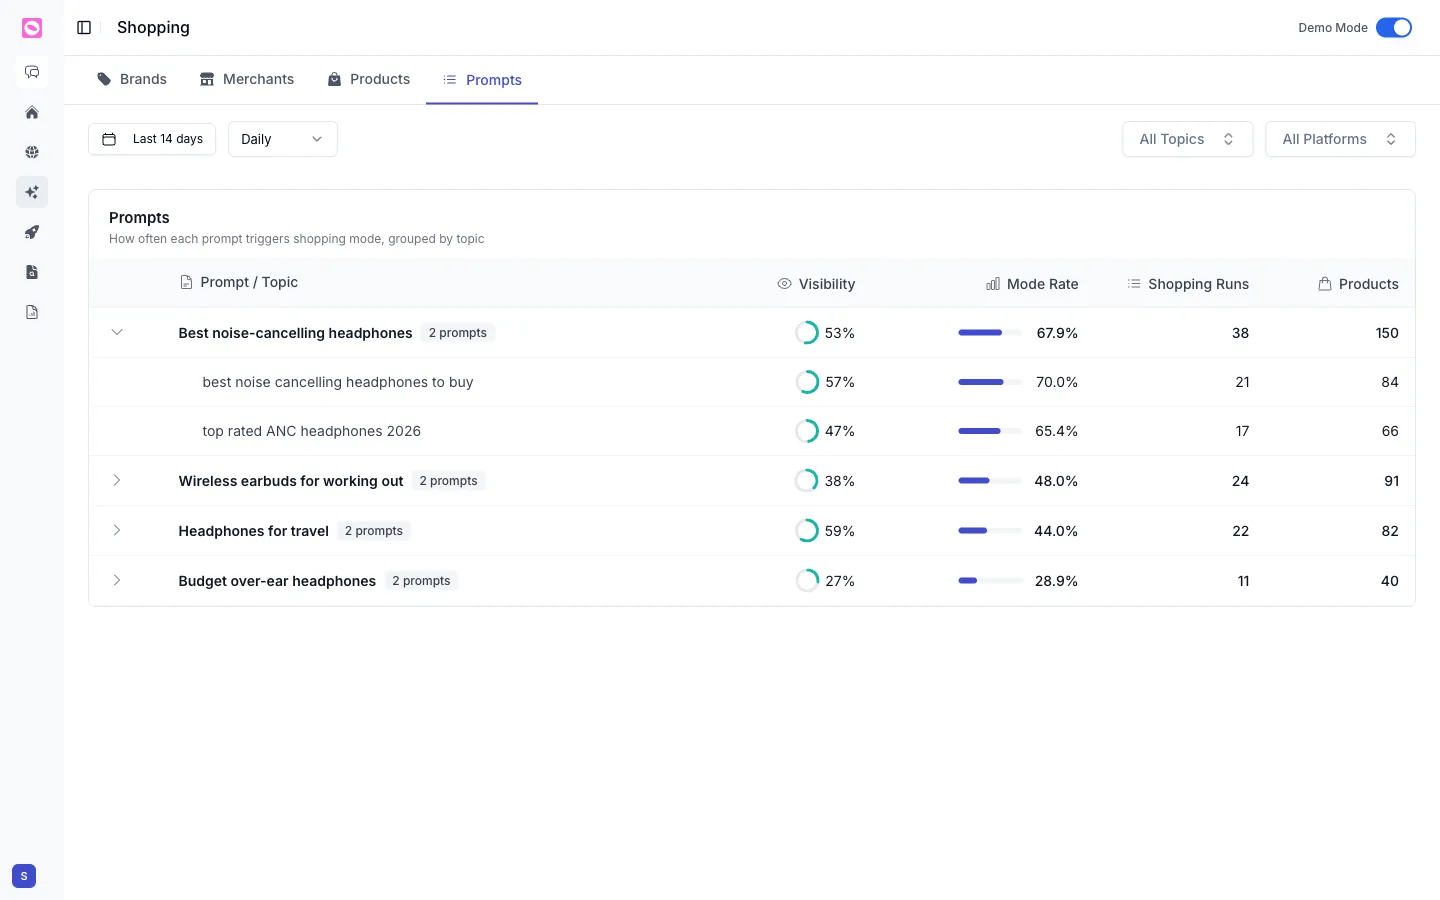
The key column is Mode Rate: the share of runs where that prompt produced a shopping result. A high mode rate means the question reliably pulls product recommendations, so visibility there is especially valuable.
You’ll also see Shopping Runs and the number of Products that appeared.
Prioritize prompts with a high mode rate where your products are missing or poorly placed. Those are the questions most likely to put a product in front of a ready-to-buy shopper. Use the topic and platform filters at the top to focus on the questions closest to a purchase.